The combination of a pause in the Fed’s rate hikes and strong year-end seasonal tendencies have created an opportunity for investors to end the year on a positive note. The fly in the ointment, in the short term, could be a bad set of readings on the upcoming Consumer (CPI) and Producer (PPI) price gauges. Aside from that, the negative sentiment on Wall Street is still thick enough to push prices higher.
As I noted last week, “The stock market seems to have bottomed, as short sellers panicked and recently frightened buyers rushed back into the markets. It’s about time, as the signs of a pending reversal have been in place for the past two months, namely a slowing economy and fears about the Fed’s rate hike cycle, which have been mounting as investor’s pessimism rose to a fever pitch.”
On the other hand, Fed Chairman Powell proved once again that a few words can kill any rally, when he noted the central bank was “not confident” that inflation was fully vanquished on 11/9/23 and stocks sank. Whether that was just tough talk or a sign that he knows what the CPI and PPI numbers will show is anyone’s guess. Thankfully, the market recovered, although, as I discuss below, breadth remains weaker than one would hope for.
That said, there is no substitute for being prepared for any eventuality. For now, the trend is bullish, so here are three groups that should move higher, barring any unpleasant surprises.
It’s What’s Inside That Matters; Three Sectors Worth Watching as the Year End Rally Develops
Most investors focus on areas of the market which are exhibiting strength. That’s because, in bull markets, strength usually leads to further strength. This, of course, is the essence of momentum investing.
At the same time, it’s also useful to review the action in weak sectors, as underperformers are often future areas of value. Moreover, it’s important to know what you’re buying. Here is what I mean.
The software sector encompasses a wide swath of companies ranging from security companies to app developers, along with those in the increasingly popular AI sector. With so many companies, it’s often more practical to buy into a diversified portfolio, such as an ETF.
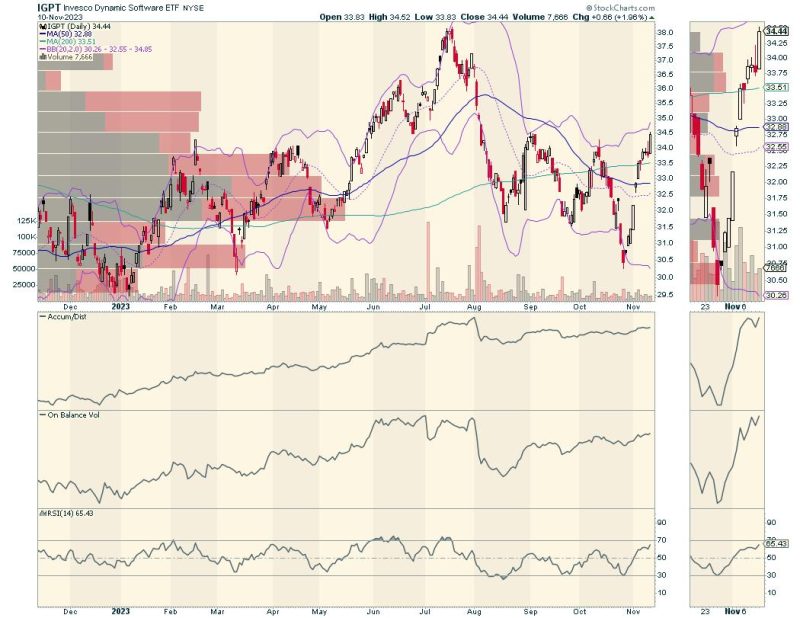
One such ETF is the Invesco Dynamic Software ETF (IGPT), recently renamed Invesco AI and Next Gen Software ETF, which is closing in on what could be a major breakout. But don’t let the title fool you; this ETF holds the usual large-cap tech stocks that typically rally when the tech sector moves into a rising trend, such as what is currently developing and is evident in the price chart for the Invesco QQQ Trust ETF (QQQ). QQQ holds many of the same companies, but currently trades at ten times the price of IGPT.
So, you can pay ten times more for QQQ, or get the same general market exposure via IGPT for a fraction of the price. Consider that IGPT is currently trading below $40 per share, which means you can own shares in Meta (META), Alphabet (GOOGL), Adobe (ADBE), and even NVDIA (NVDA) for a fraction of the price of each of these blue chips.
And here’s what the price chart is telling us regarding IGPT:
The ETF is back in bullish territory, as it just crossed above its 200-day moving average;Accumulation/Distribution (ADI) is moving higher after a recent consolidation as short sellers leave the scene;On Balance Volume (OBV) is in an established uptrend, as buyers come in; andA move above $36 will likely take this ETF higher, as long as the bullish trend in the technology sector remains in place.
Another bullish sector which remains undervalued is the uranium mining sector, as in the Global X Uranium ETF (URA), in which I own shares and which is a core holding at Joe Duarte in the Money Options.com. Nuclear power is slowly becoming an option for areas of the world which are trying to find a compromise between clean fuels and reliable power generation.
URA’s appeal has been boosted by the demise of the renewable power sector over the last few months, due to the expense burden and supply chain challenges required to build wind turbines. Note the difference in the performance of URA versus the First Trust ISE Global Wind Energy ETF (FAN).
For one, URA is in a bullish consolidation pattern after its recent breakout. Note the excellent support at $26, where the 50-day moving average and a large Volume-by-Price (VBP) bar continue to attract buyers. Moreover, note the bullish uptrend in OBV as buyers sneak into the shares.
Certainly, FAN is in a consolidation pattern of its own after its recent collapse. Note, however, that neither ADI or OBV have turned up yet, which means that there is currently little interest in these shares from bullish investors. On the other hand, from a contrarian standpoint, it’s not a bad idea to keep an eye on this ETF as the cycle works itself out. All it would take for this sector to bottom out would be something like a large infusion of government cash, such as what may be materializing in Europe, according to reports.
I recently recommended an ETF which is now breaking out in a big way. Join the smart money at Joe Duarte in the Money Options.com, where you can have access to this ETF and a wide variety of bullish stock picks FREE with a two-week trial subscription.
Bonds Retain Bullish Tone Ahead of Inflation Numbers
As I noted last week, bond yields have made at least a short-term top. In fact, just three weeks ago, the U.S. Ten Year note yield (TNX) hit the 5% point, an event that unhinged both stock and bond traders.
Since then, things have quieted down and TNX has settled into a trading range, with 4.5% and the 50-day moving average as the floor.
If the inflation numbers are bullish, and TNX breaks below 4.5%, expect a big move up in stocks.
Keep an eye on the SPDR S&P Homebuilders ETF (XHB), specially the $78-$80 area. If CPI and PPI are bullish and bond yields fall, XHB should rise as short sellers get squeezed. Note the improvement in ADI, as the shorts cover their bets, while OBV is still holding steady, as buyers remain patient.
I’ve recently posted several detailed articles on mortgage rates, bonds, and homebuilders at my Buy Me a Coffee page. You can access them here. For the perfect price chart set up, check out my latest Your Daily Five video here.
Market Breadth Lags Rally as Indexes Outperform
The NYSE Advance Decline line (NYAD) has bottomed out, but has yet to cross above its 50- or 200-day moving averages. So, for now, NYAD is neutral to slightly positive. If it doesn’t show a bit more pop in the next few weeks, it may signal that the rally will have short legs.
In contrast, the Nasdaq 100 Index (NDX) is nearing a breakout after rallying above its 50-day moving average. Both ADI and OBV turned higher as short sellers cover (ADI) and buyers move in (OBV). A move above 15,800-16,000 would likely extend the rally further.
The S&P 500 (SPX) is also lagging NDX, but has delivered a minor breakout above 4400. SPX is well above its 200-day moving average, returning to bullish territory after its recent dip below 4150. Moreover, it has now survived a test of the 4350 support area.
VIX is Back Below 20
The CBOE Volatility Index (VIX) is well below 20. This is bullish.
A rising VIX means traders are buying large volumes of put options. Rising put option volume from leads market makers to sell stock index futures, hedging their risk. A fall in VIX is bullish, as it means less put option buying, and it eventually leads to call buying. This causes market makers to hedge by buying stock index futures, raising the odds of higher stock prices.
To get the latest information on options trading, check out Options Trading for Dummies, now in its 4th Edition—Get Your Copy Now! Now also available in Audible audiobook format!
#1 New Release on Options Trading!
Good news! I’ve made my NYAD-Complexity – Chaos chart (featured on my YD5 videos) and a few other favorites public. You can find them here.
Joe Duarte
In The Money Options
Joe Duarte is a former money manager, an active trader, and a widely recognized independent stock market analyst since 1987. He is author of eight investment books, including the best-selling Trading Options for Dummies, rated a TOP Options Book for 2018 by Benzinga.com and now in its third edition, plus The Everything Investing in Your 20s and 30s Book and six other trading books.
The Everything Investing in Your 20s and 30s Book is available at Amazon and Barnes and Noble. It has also been recommended as a Washington Post Color of Money Book of the Month.
To receive Joe’s exclusive stock, option and ETF recommendations, in your mailbox every week visit https://joeduarteinthemoneyoptions.com/secure/order_email.asp.


