


The previous weekly note categorically mentioned that while the markets may continue to decline, the Indian equities are set to outperform its global peers relatively. In line with this analysis, the market saw wide swings owing to prevailing global uncertainties but continued showing remarkable resilience against other global indices. The volatility spiked; the India VIX surged sharply by 46.18% to 20.11 on a weekly basis. The markets witnessed significant volatility, and as a result, the Nifty oscillated in a wide 1180.25 range during the past week. Despite this, the headline index Nifty 50 closed with a negligible loss of just 75.90 points (-0.33%).
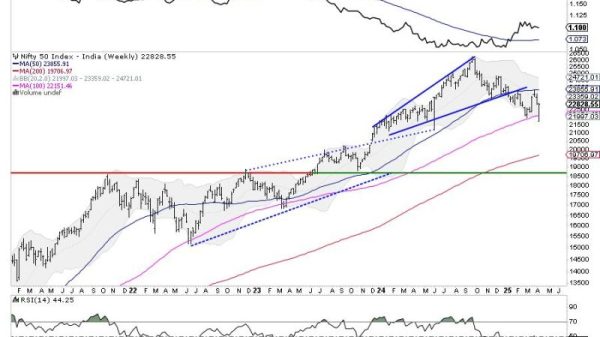
The coming week is also short; Monday is a trading holiday for Dr. Babasaheb Ambedkar Jayanti. From a technical perspective, a few of the significant things have happened. Although the Nifty formed a fresh swing low of 21743 while slipping below its previous low of 21964, the Index has successfully defended the important support level of 100-week MA that stands at 22152. This level remains a very important support level for the market in the near term. So long as the Nifty keeps its head above this point, it will stay in a larger range but would avert any major drawdown. A violation of this level will invite structural weakness in the markets. On the upper side, it faces stiff resistance between the 23300-23400 zone, which houses the 20-week MA.
With Monday being a holiday, Tuesday will see the markets opening after a gap of one day and adjusting to the global trade. The levels of 23000 and 23250 may act as potential resistance points; the supports come in much lower at 22400 and 22150.
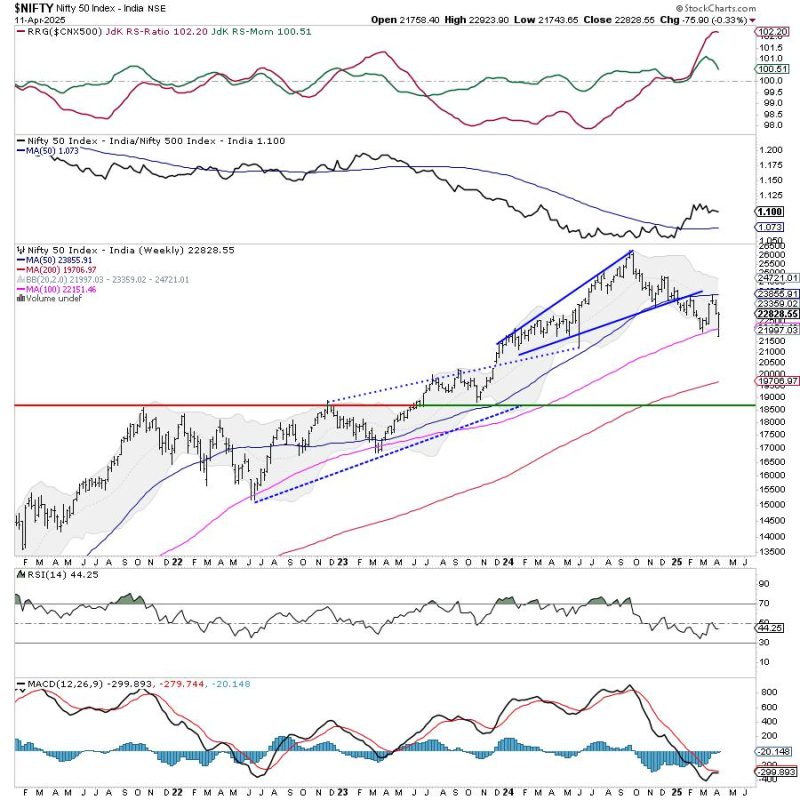
The weekly RSI is at 44.28; it stays neutral and does not show any divergence against the price. The weekly MACD is bearish and stays below its signal line; however, the narrowing Histogram hints at a likely positive crossover in the coming days.
The pattern analysis of the weekly Nifty chart reflects a strong rebound following a successful test of the 100-week moving average in early March, triggering a sharp 1,700-point rally. However, recent corrective moves driven by tariff-related concerns have led to the formation of a new swing low. Despite this, the Index has managed to hold above the crucial 100-week moving average level of 22,152 on a closing basis, which remains a key support zone. As long as the Nifty sustains above this level, the Index is likely to consolidate rather than witness any significant decline. However, a decisive breach below this average could open the door to a deeper corrective phase, which looks unlikely in the near future.
Overall, the Nifty is expected to encounter resistance around the 23,100 level and above, with volatility likely to remain a dominant feature in the near term. The Index may continue to trade within a broad range, making it prudent to adopt a cautious stance. Investors are advised to limit leveraged positions and prioritize protecting gains at higher levels. For fresh entries, the focus should remain on stocks exhibiting relative strength. Given the prevailing uncertainty, maintaining a conservative approach with modest exposure is recommended for the upcoming week. Risk management and selective participation will be essential to effectively navigate the anticipated market swings.
Sector Analysis for the coming week
In our look at Relative Rotation Graphs®, we compared various sectors against CNX500 (NIFTY 500 Index), which represents over 95% of the free float market cap of all the stocks listed.
Relative Rotation Graphs (RRG) show the Nifty Infrastructure, Metal, Banknifty, Services Sector, Consumption, Commodities, and Financial Services sector Indices inside the leading quadrant. Regardless of the direction the markets adopt, these groups are likely to post relative outperformance against the broader markets.
The Nifty Pharma Index is the only sector index present in the weakening quadrant.
The Nifty Auto Index has rolled inside the lagging quadrant, while the IT Index continues to languish inside the lagging quadrant. Besides this, the Midcap 100, Media, and Realty indices are also inside this quadrant, but they are improving on their relative momentum.
The Nifty FMCG, Energy, and PSE Indices are inside the improving quadrant; they are expected to improve their relative performance against the broader Nifty 500 Index.
Important Note: RRG charts show the relative strength and momentum of a group of stocks. In the above Chart, they show relative performance against NIFTY500 Index (Broader Markets) and should not be used directly as buy or sell signals.
Milan Vaishnav, CMT, MSTA
Consulting Technical Analyst