The last full trading week before the Thanksgiving holiday has ended on a positive note. Following up on yesterday’s blog post, the S&P 500 Equal Weighted Index ($SPXEW) has continued to outperform the S&P 500’s price action and hit a new all-time high. Similarly, the Nasdaq 100 Equal Weighted Index ($NDXE) is close to its all-time high (0.10% away from it according to the Distance to 52-Week High indicator).
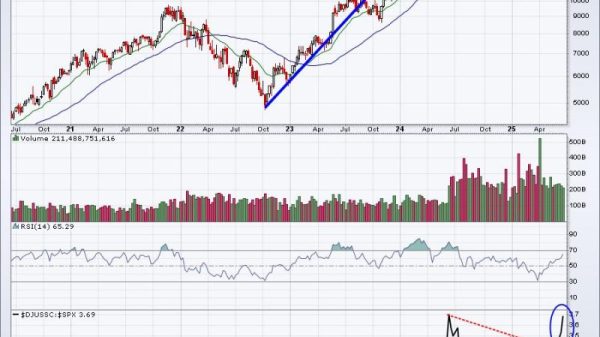
The mid and small-cap indexes, $MID and $SML, remained market index leaders on Friday. From the daily chart of the S&P 600 Small Cap Index ($SML) below, note how the index broke out of a sideways trading range, climbed to a high on November 11, and then pulled back and bounced off the previous October high resistance level. It’s now on its way back to its all-time high.
FIGURE 1. DAILY CHART OF S&P 600 SMALL CAP INDEX ($SML). A breakout followed by a pullback and then a bounce of a support level looks promising for small-cap stocks.Chart source: StockCharts.com. For educational purposes.
The percentage of stocks trading above their 50-day moving average is rising, and advances outperform decliners. With market breadth supporting bullish price action, it’s safe to say that investors are piling into small caps.
So, in a nutshell, Friday’s price action was a continuation of Thursday’s action. The S&P 500 ($SPX) and Dow Jones Industrial Average ($INDU) are approaching their all-time highs, but the Nasdaq Composite ($COMPQ) still has to break through 19,080 to make its way to its all-time high.
In addition to equities, precious metals, especially gold, have also been climbing higher. The daily chart of the SPDR Gold Shares ETF (GLD) below shows that after hitting a high on October 30, GLD fell approximately 8.30%. It has now bounced back, rising around 5.80% from the November 14 low. GLD faces resistance that sits slightly above $250 (red horizontal dashed line) and support from its 25-day simple moving average.
FIGURE 2. DAILY CHART OF SPDR GOLD SHARES (GLD). Gold’s rise, pullback, and rebound make it a chart worth adding to your ChartLists.Chart source: StockCharts.com. For educational purposes.
If GLD overcomes that resistance next week, it indicates that investors’ concerns about slower rate cuts and geopolitical tensions remain front and center.
The Greenback Keeps On Growing
The US dollar has also been rising, hurting other currencies, especially the euro. The weekly chart of $EURUSD below shows it hitting levels it last saw at the end of 2022.
FIGURE 3. WEEKLY CHART OF $EURUSD. The steep fall in the euro could be due to a weakening European economy and concerns about geopolitical tensions.Chart source: StockCharts.com. For educational purposes.
The rise in the greenback is due to a strong US economy, but the move in the $EURUSD is significant. Europe is experiencing slower economic growth, but geopolitical concerns have also risen. The two may be the reason for the intensity of the fall in the euro.
Usually, a stronger dollar puts pressure on commodities such as precious metals, but that’s not happening right now. Besides potential geopolitical tensions, there’s also the concern that the Fed may have fewer interest rate cuts next year. According to the CME FedWatch Tool, the probability of a 25 basis point in the December FOMC meeting has dropped to 56.20%.
Bitcoin’s Bold Move
You can’t help but notice Bitcoin’s rise this week. The cryptocurrency crossed its psychological $100,000 level, but closed slightly lower at $99,210 (see chart below).
FIGURE 4. DAILY CHART OF BITCOIN. The explosive rally in Bitcoin has caught everyone’s attention. $BTCUSD hit the psychological $10K level but couldn’t hold on to it.Chart source: StockCharts.com. For educational purposes.
After bouncing off its 21-day exponential moving average (EMA) in early November, $BTCUSD rocketed higher, consolidated for about seven days, and then continued its journey higher. The moving average convergence/divergence indicator in the bottom panel shows no signs of slowing down.
Looking Ahead
There’s been a lot of excitement this week. Next week is a short trading week, but there are some key economic data to watch, the more important ones being the PCE, durable goods orders, and FOMC minutes. This would bring the focus on what the Fed is likely to do when it meets next. If there’s an indication of no rate cuts in the December meeting, we could see more of the same price action spill into next week.
If you want to be notified of new articles published in the ChartWatchers blog, sign up on this page.
End-of-Week Wrap-Up
S&P 500 up 1.68% for the week, at 5969.34, Dow Jones Industrial Average up 1.96% for the week at 44,296.51; Nasdaq Composite up 1.73% for the week at 19,003.65
$VIX down 5.20% for the week, closing at 15.30
Best performing sector for the week: Materials
Worst performing sector for the week: Health Care
Top 5 Large Cap SCTR stocks: Summit Therapeutics (SMMT); Applovin Corp. (APP); MicroStrategy Inc. (MSTR); Texas Pacific Land (TPL); Palantir Technologies (PLTR)
On the Radar Next Week
October New Home Sales
FOMC Minutes
October Durable Goods Orders
October PCE Price Index
November Chicago PMI
Disclaimer: This blog is for educational purposes only and should not be construed as financial advice. The ideas and strategies should never be used without first assessing your own personal and financial situation, or without consulting a financial professional.

