


2025 is off to a rough start for stocks, but there are still some pockets of strength in the market. Year-to-date, SPY is down 1.73%, QQQ is down around 4% and the S&P SmallCap 600 SPDR (IJR) is down over 6%. ETFs with smaller losses show relative strength (less weakness), but ETFs with year-to-date gains show relative, and more importantly, absolute strength. This is where we should focus.
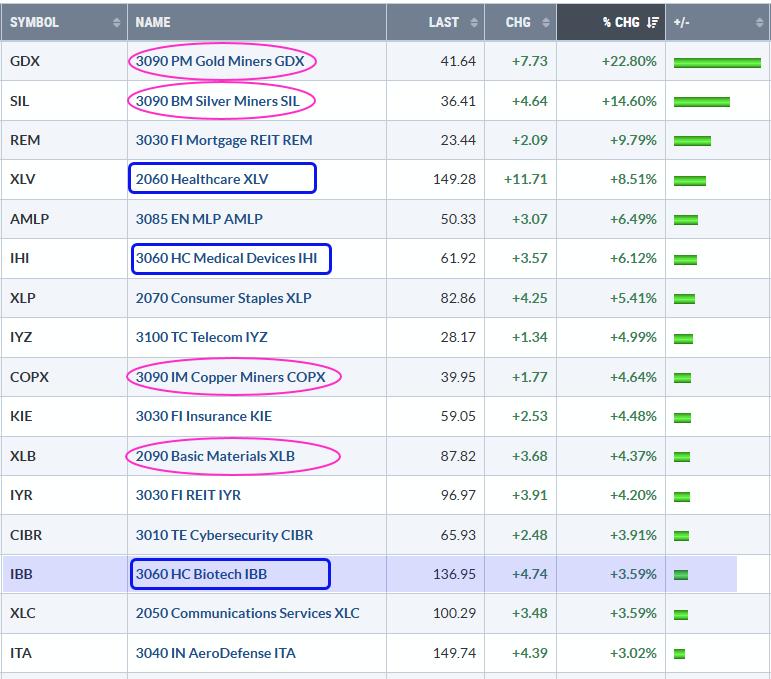
The table below shows some of the best performing equity ETFs. Three themes are clear. First, commodity-related stocks are performing well with gains in Gold Miners (GDX), Copper Miners (COPX), Materials (XLB) and Energy (XLE). Second, defensive groups are performing well with gains in Healthcare (XLV), Consumer Staples (XLP), Telecom (IYZ) and Insurance (KIE). Third, two groups within the healthcare sector are also performing well: Medical Devices (IHI) and Biotech (IBB).
Get the last ETF ChartList you will ever need – free with a trial subscription to TrendInvestorPro. Organized in a logical top-down manner, our highly curated ChartList has 59 equity ETFs, 7 commodity ETFs and 4 bond ETFs. This core list is designed for all market conditions and forms the basis for a momentum rotation strategy that I will unveil in the coming weeks. Get your ChartList today. Click here to take a trial to TrendInvestorPro.
Among the 2025 leaders, the Biotech ETF (IBB) caught my attention because it is in a long-term uptrend and recently broke out of a falling wedge. The chart below shows weekly candlesticks with resistance breaks (higher highs) in December 2023 and July 2024. We also see higher lows in April 2024 and December 2024 (gray arrows). IBB also tagged a 52-week high in September 2024. Price action may be choppy, but there is an uptrend in play with higher highs, higher lows and a 52-week high.
After tagging a new high, IBB plunged in November on news of the RFK Jr. appointment (long black candlestick). A falling wedge ultimately formed and I view this as a correction after the April-September advance. Why? Because the bigger trend is up and IBB held well above the April low. The wedge breakout signaled an end to this correction and a resumption of the bigger uptrend. Short-term, there are two levels to watch as the ETF consolidated around the breakout zone in the 137.5 area. A close below 132 (blue line) would negate the breakout and call for a re-evaluation. A breakout at 141 (pink line) would solidify the breakout and keep the uptrend alive.
Click here to take a trial, get your ETF chart list and gain full access to our strategy reports, signal page, ranking tables.
////////////////////////////////////////