


The S&P 500 index managed to log one of its strongest weeks in 2025. Short-term breadth conditions have improved, and the crucial 5500 level has now been broken to the upside. Are we in the later stages of a countertrend rally, or just in the early innings of a broader recovery for stocks?
Let’s review three key charts together and evaluate the evidence.
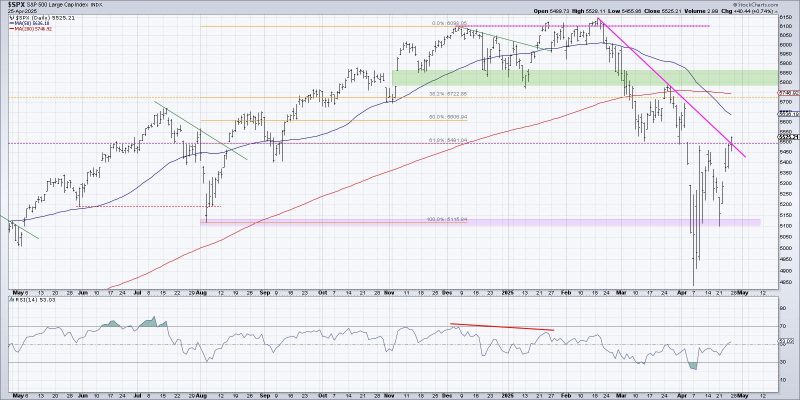
Trendline Break Suggests Further Short-Term Strength
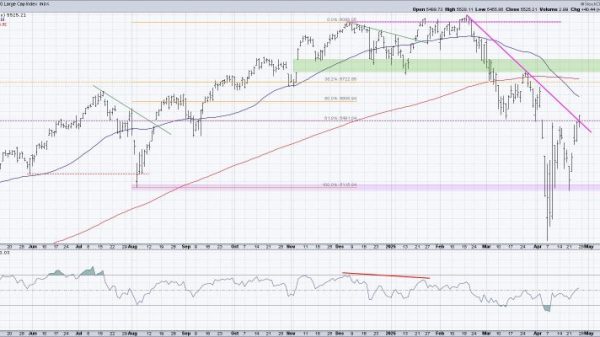
My daily chart of the S&P 500 has featured a thick pink trendline since March, when a lower peak around 5800 provided a perfect opportunity to define the downtrend phase. With the quick reversal off the early April low around 4850, the SPX has finally broken back above this trendline.
To be clear, after a breakout of this magnitude, I’m always looking for confirmation from the following day. Will additional buyers come in to push this chart even further to the upside? Assuming that’s the case, then I’m immediately drawn to a confluence of resistance in the 5750-5850 range. The 200-day moving average is currently sitting right around the late March peak, and both of those levels line up well with a price gap back in November 2024.
If the S&P 500 can finally break above that resistance range, I would expect much further upside for risk assets.
Breadth Conditions Confirm Short-Term Market Strength
One of the biggest improvements I’ve seen coming out of the early April low is the upgrade in short-term breadth conditions. The McClellan Oscillator has broken back above the zero level, most days this week saw more advancers than decliners, and the Bullish Percent Index has definitely improved.
In the bottom panel, we can see that the S&P 500 Bullish Percent Index has risen from a low just above 10% at the April low to finish this week at 64%. That confirms that over half of the S&P 500 members generated a point & figure buy signal in the month of April!
But the middle panel shows the real challenge here, in that long-term measures of breadth are still clearly in the bearish range. Just 35% of the S&P 500 stocks are above their 200-day moving average, similar to the S&P 500 and Nasdaq 100. It’s only if this indicator can push above the 50% level that the S&P 500 could stand a real chance of sustainable gains above 5750.
The Stoplight Technique Lays Out a Clear Playbook
I love to overlay a “stoplight” visualization on a chart like this, helping me clarify how I’ll think about risk depending on where the S&P 500 sits at any given point.
I would argue that a confirmed break above resistance at 5500 brings the S&P 500 chart into the “neutral” bucket. In this way, we’re respecting the fact that a rally from 4850 to 5500 is a fairly impressive feat, but also acknowledging that the SPX remains below its most important long-term trend barometer, the 200-day moving average.
If we see further gains in the weeks to come, the SPX may indeed push into the bullish range, which for me would mean a push above 5750-5800. In that scenario, the S&P 500 would be clear of its 200-day moving average, and I would feel much more comfortable adding risk to the portfolio. Until and unless we see that upside follow-through, though, I’ll remain comfortably defensive.
RR#6,
Dave
P.S. Ready to upgrade your investment process? Check out my free behavioral investing course!
David Keller, CMT
President and Chief Strategist
Sierra Alpha Research LLC
Disclaimer: This blog is for educational purposes only and should not be construed as financial advice. The ideas and strategies should never be used without first assessing your own personal and financial situation, or without consulting a financial professional.
The author does not have a position in mentioned securities at the time of publication. Any opinions expressed herein are solely those of the author and do not in any way represent the views or opinions of any other person or entity.